Author name: 胡思

The Invisible Mega-Project: Why London Spent £4.5 Billion on a New Underground Sewer

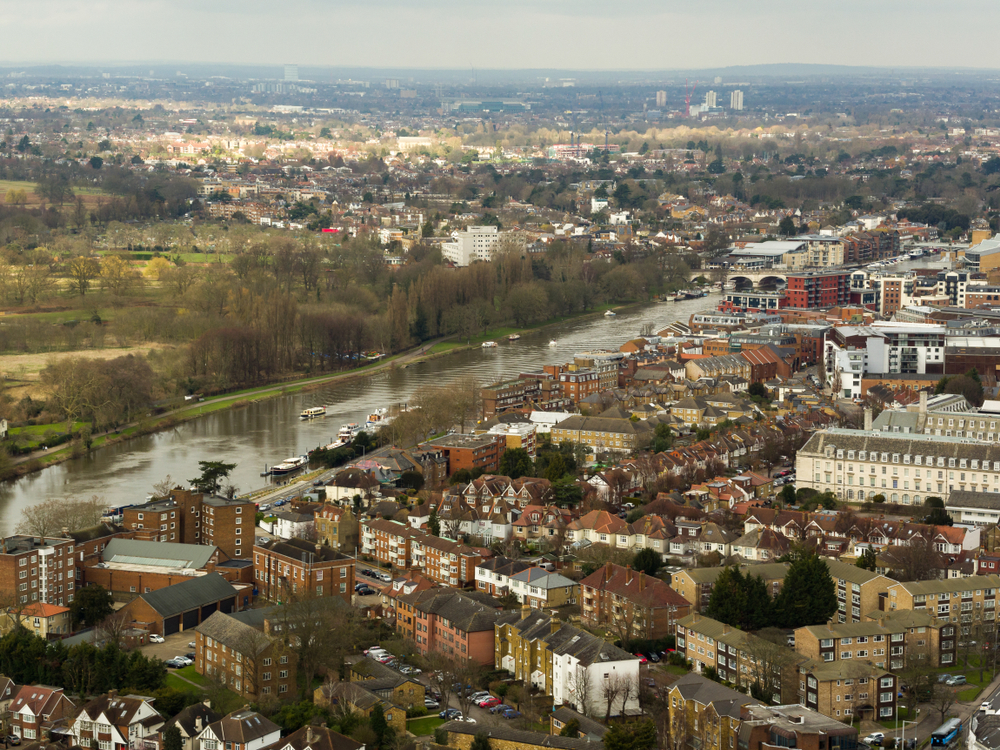
Beneath the River Thames runs a tunnel stretching about 25 kilometres. Most people will never see it, yet this tunnel now captures large volumes of sewage that would otherwise spill into the river. Known as the Tideway Tunnel, it runs beneath the river from Acton in west London to Abbey Mills in east London, before directing flows to the Beckton sewage treatment works. The project cost about £4.5 billion and has often been described as London’s “super sewer”.

To understand why this tunnel is needed, it helps to look at London’s original sewer system. Much of the city’s main sewer network was built in the nineteenth century during the Victorian era, designed by the engineer Joseph Bazalgette. At the time London was struggling with repeated cholera outbreaks and severe river pollution. Bazalgette’s system was a remarkable engineering achievement, carrying sewage away from the city to downstream discharge points. However, the system was designed for a city of roughly three million people.

Today Greater London has more than nine million residents, far beyond the capacity the original system was built for. More importantly, much of the Victorian drainage system uses what engineers call a combined sewer system. In this design, rainwater and wastewater share the same pipes. Under normal conditions, sewage from homes and businesses flows through the sewers to treatment plants such as Beckton in east London, where it is treated before being released back into the river.

The problem arises during heavy rain. When large volumes of stormwater rush into the sewers, flows can increase dramatically within a short period of time. If all of this water were forced toward treatment plants, pipes and pumping stations could become overwhelmed. In extreme cases, sewage could even back up into streets or buildings. To prevent this, the system includes overflow outlets along the river. When water levels rise too high, some of the mixed stormwater and sewage is discharged directly into the Thames. This mechanism is known as a Combined Sewer Overflow.

In the nineteenth century this was a sensible safety feature. But in a modern city with a much larger population and extensive paved surfaces, these overflows occur far more frequently. Before the construction of the Tideway Tunnel, there were dozens of overflow points along the Thames. During heavy rainfall events, large quantities of untreated wastewater could enter the river.

The engineering logic behind the Tideway Tunnel can be understood in three steps: interception, storage and treatment. Instead of allowing overflow pipes to discharge into the Thames, many of them are now connected to the new tunnel system. When the existing sewer network reaches capacity during heavy rain, excess flows are diverted into the Tideway Tunnel rather than into the river.

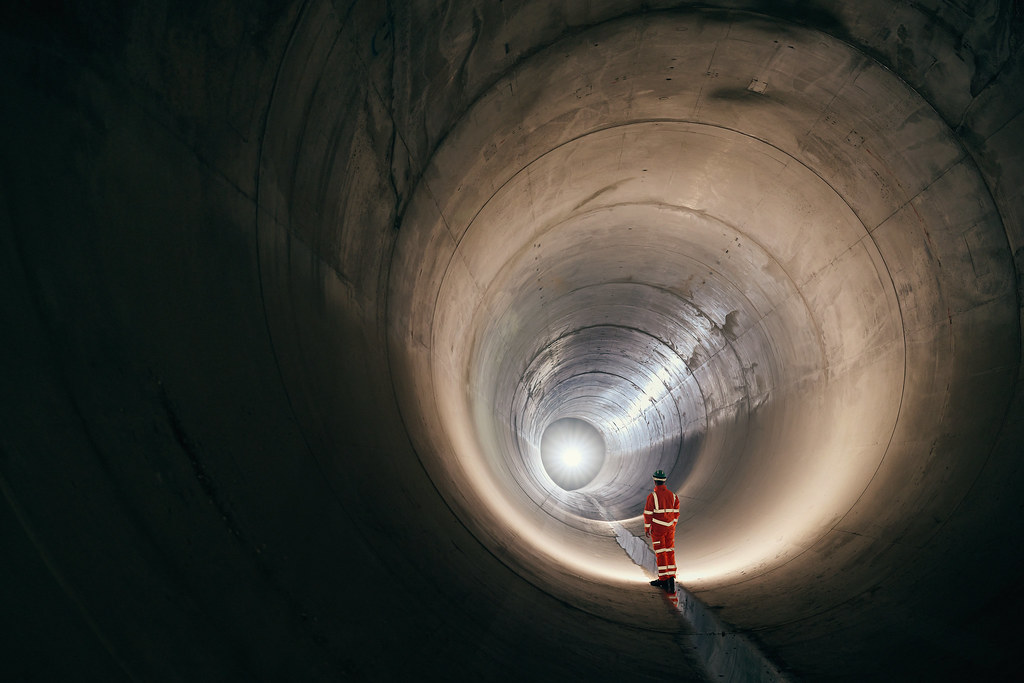
The tunnel itself acts as a vast underground storage reservoir. The system can hold about 1.6 million cubic metres of water, roughly equivalent to around 640 Olympic-sized swimming pools. During storms, the excess wastewater is temporarily stored inside the tunnel. Once the rainfall subsides and treatment plants regain spare capacity, the stored sewage is gradually pumped to Beckton for treatment.

The design also takes advantage of gravity. The tunnel slopes gradually from west to east, starting at depths of around 30 metres in west London and reaching more than 60 metres in parts of east London. This allows wastewater to flow naturally toward the lower end of the system before being pumped onward to the treatment works.

Construction began in 2016. Tunnel boring started in 2018, and the main tunnelling works were completed in 2022. The following years were spent connecting the new tunnel to existing infrastructure and testing the system. The full network became operational in February 2025, and the project was officially opened on 7 May 2025 by King Charles III.

The completed system is designed to reduce sewage overflows into the Thames by about 95 percent. For a river once described in the 1950s as “biologically dead”, this marks another important step in its long recovery.

The tunnel itself will never become a landmark. Most Londoners will never see it. Yet cities depend on precisely this kind of invisible infrastructure. Roads, power grids and water systems quietly support daily life without drawing attention. Tideway Tunnel sits deep underground, out of sight, but the improvement in river water quality will be visible and tangible. Residents walking along the riverbanks, and visitors coming to London, will gradually experience a cleaner Thames thanks to this unseen piece of engineering.

The Invisible Mega-Project: Why London Spent £4.5 Billion on a New Underground Sewer Read More »

Do You Live in the “King’s Town”? Why Hongkongers Are Settling in Kingston upon Thames

Many Hongkongers who move to Kingston upon Thames may not realise that the town’s name itself carries a piece of English history. Kingston literally means “King’s Town”. During the Anglo-Saxon period several English kings were crowned here. In the town centre today, the Coronation Stone still stands as a reminder of those ceremonies. Modern Kingston is now a lively suburban centre of London, yet its name reflects a past when it played a symbolic role in the formation of the English kingdom.

In recent years the town has also gained a new group of residents. Since the launch of the British National Overseas visa in 2021, many Hong Kong families have moved to Britain. Kingston has gradually emerged as one of the places where these new arrivals choose to settle. The local council has acknowledged a growing Hong Kong community in the borough. Such clustering is rarely accidental. It usually reflects a combination of practical factors that quietly shape where migrants decide to live.

Education is often the most immediate reason. Many Hong Kong families arrive with school-age children, so the quality of local schools becomes a central consideration. Kingston is home to several highly regarded secondary schools. Tiffin School and Tiffin Girls’ School are widely recognised as among the leading grammar schools in the country. For families familiar with Hong Kong’s exam-oriented culture, the reputation of these schools carries considerable weight. When good schools are concentrated in a particular area, families with similar priorities tend to gather around them.

Transport and geography also play an important role. Kingston lies in southwest London and trains reach Waterloo in roughly half an hour. For many commuters this provides a workable balance between access to central London and more manageable housing costs. The wider southwest London area forms a long-established residential belt. Neighbouring places such as Richmond, Wimbledon and Surbiton are well known for stable communities and good public services.

The living environment adds another layer of attraction. The River Thames runs through Kingston’s town centre. Along the riverside are cafés, restaurants and walking paths. For many people arriving from the dense urban landscape of Hong Kong, the combination of urban convenience and open riverside space offers a noticeably different pace of life. Nearby Richmond Park and Bushy Park are among London’s largest royal parks, where deer still roam freely. In this part of London the boundary between city and nature feels unusually close.

The surrounding historical landscape also contributes to the character of the area. Not far from Kingston stands Hampton Court Palace, the Tudor residence closely associated with Henry VIII. Residents often cycle or walk along the Thames towards the palace grounds. Daily life and centuries of English history sit side by side in this landscape in a way that few London suburbs can easily replicate.

Future transport plans add another layer of possibility. The proposed Crossrail 2 project would connect southwest London to the capital’s core with a high-frequency cross-city railway. Kingston is expected to fall within the service area of the route. If the project is eventually realised, commuting capacity between southwest London and central London would increase significantly, potentially strengthening the strategic position of the entire area.

Yet the formation of any migrant community ultimately depends on social networks. Once the first few families settle, information spreads through friends, social media groups, churches and community organisations. New arrivals often follow familiar paths rather than starting from scratch. Gradually a location that once appeared simply as a point on the map begins to take on meaning within the shared mental map of a community.

Migration geography often emerges in exactly this way. What begins as a handful of personal choices slowly becomes an invisible route that others follow. Kingston was once known for the crowning of kings. Today it is also gaining recognition for a new chapter in its story. Many residents may pass the Coronation Stone without much thought, yet the name of the town continues to whisper its past. Kingston remains the King’s Town, even as new communities add their own layers to its history.

Do You Live in the “King’s Town”? Why Hongkongers Are Settling in Kingston upon Thames Read More »

Europe’s Energy Destiny: Why Fossil Fuel Self-Sufficiency Is Impossible

The core contradiction of Europe’s energy problem is simple: demand is large, but underground resources are limited. This is not a short-term policy failure or a temporary market fluctuation. It is closer to a geological destiny. Compared with regions such as the Persian Gulf or western Siberia, Europe simply does not possess the large petroleum basins capable of sustaining a modern economy for long.

Oil and gas are never distributed evenly across the planet. The world’s largest reserves are concentrated in only a few regions, notably the Persian Gulf and the West Siberian Basin. These areas were once covered by vast and stable shallow seas. Over millions of years, enormous quantities of microscopic marine life accumulated on the seabed, forming thick layers of organic-rich rock. As these layers were buried and heated, they transformed into hydrocarbons. Crucially, geological structures formed huge traps that allowed oil and gas to accumulate into giant fields.

Europe’s geological history followed a different path. Much of the continent sits on very old continental crust. Sedimentary basins tend to be smaller, and the region has experienced multiple episodes of tectonic deformation over geological time. These movements often fragmented potential reservoirs into smaller pockets. In other words, Europe is not devoid of hydrocarbons, but it rarely forms the giant fields that define major petroleum provinces.

The North Sea is the main exception. Formed during the opening of the Atlantic Ocean, this rift basin accumulated organic-rich sediments and developed good sandstone reservoirs. This allowed the United Kingdom and Norway to become major oil producers during the late twentieth century. Yet even the North Sea fields are much smaller than the giant fields of the Middle East, and most lie offshore, making extraction more expensive.

More importantly, the North Sea is now a mature basin. British production peaked in the early 2000s and has declined steadily since. Norway still maintains significant output, but new discoveries are generally smaller. Even if Norway is considered part of Europe’s broader energy system, total European oil production remains far below its consumption.

Natural gas offers a slightly stronger position, but the structural limits remain. The Groningen field in the Netherlands was once one of Europe’s largest gas sources, yet production has been phased out due to earthquake risks. Newer fields in the Norwegian Sea and the Barents Sea exist, but their scale cannot replace Europe’s import needs. Even after the reduction of Russian pipeline gas, Europe continues to rely heavily on imported liquefied natural gas.

This structural gap leads to a straightforward conclusion. Europe cannot achieve energy self-sufficiency simply by expanding fossil fuel extraction. Even if every potential basin were redeveloped, the most likely outcome would be a modest reduction in imports rather than a fundamental change in the balance.

That reality explains why Europe has invested heavily in wind and solar power in recent years, while retaining nuclear energy and exploring geothermal resources. Unlike oil and gas, these energy sources are far more evenly distributed. They allow countries to generate energy locally rather than relying on a handful of resource-rich regions.

Seen from this perspective, Europe’s energy transition is not only a climate policy but also a pragmatic response to geological constraints. When the limits of underground resources are already set by nature, the only variable left to change is the structure of the energy system itself. For Europe, reducing dependence on fossil fuels is the only way to escape this energy destiny.

Europe’s Energy Destiny: Why Fossil Fuel Self-Sufficiency Is Impossible Read More »

From Work Ban to Hotel Requisition: Britain’s Self-Fulfilling Asylum Policy Trap

The central contradiction of Britain’s asylum system today can be summarised simply: the more restrictive the policy becomes, the harder the problem is to manage.

The story begins in 2002. Under political pressure, the government of Tony Blair removed the right of asylum seekers to work while their claims were pending. Previously, if an application had not been decided within six months, asylum seekers could enter the labour market. After the change, they were effectively required to rely on government accommodation and a small weekly allowance.

The intention was political damage control. The government wanted to avoid accusations that the system was attracting migrants or allowing them to “take British jobs”. Yet the long-term consequences were very different. Once asylum seekers were banned from working, they became dependent on the state throughout the entire decision process. Whenever decisions slowed, the demand for accommodation inevitably increased.

In the early years the system still functioned. Asylum seekers were placed in what was known as the “dispersal accommodation” system. This meant that government contractors rented ordinary housing across different towns and cities and distributed asylum seekers across communities instead of concentrating them in large refugee camps. But as global conflicts increased, applications rose and decisions slowed, the system’s weaknesses began to appear. When dispersal housing ran out, the government had to turn to temporary solutions. Hotels gradually became the default form of accommodation.

Restrictive policies also produced another side effect. When asylum seekers are banned from working and housed by the government for long periods, it becomes easy for the public to perceive them as a burden. This design itself fuels resentment and hostility. As public anger grows, politicians respond with even tougher policies. A cycle emerges: the stricter the rules, the greater the hostility; the greater the hostility, the stricter the rules become.

Brexit took place in this political climate. After leaving the European Union, the United Kingdom also withdrew from the Dublin Regulation. Under this system, asylum claims were generally the responsibility of the first European country a migrant entered. That allowed Britain to transfer some applicants back to mainland Europe. The system also relied on a shared fingerprint database that allowed countries to check whether someone had already applied for asylum elsewhere. After Brexit, the UK lost these mechanisms. It became harder both to return migrants to EU countries and to verify their previous asylum claims.

Another change followed. Today the small-boat crossings of the English Channel dominate political debate, but before Brexit this route was almost non-existent. When Britain still participated in European asylum cooperation, some migrants could be returned to other EU states. Once those mechanisms disappeared, Channel crossings gradually increased and quickly became a powerful political symbol.

Pressure on the system worsened further in recent years. Toward the end of its time in office, the Conservative government deliberately slowed asylum processing in the belief that long delays would reduce the system’s “pull factor”. The theory was that if asylum seekers expected a difficult and prolonged process, fewer would attempt to come to Britain. In practice the opposite occurred. Applications piled up, waiting times lengthened and accommodation demand expanded rapidly. A policy intended to deter migration ended up making the system far more expensive and harder to manage.

In this environment the Conservative government introduced another deterrence policy: the Rwanda scheme. Its central idea was to transfer some asylum seekers to Rwanda for their claims to be processed there. The hope was that this would discourage migrants from attempting the journey to Britain. The government paid hundreds of millions of pounds to Rwanda, yet the scheme was designed to process only a few hundred people — insignificant compared with the tens of thousands of asylum applications each year. Rwanda is also an authoritarian state. Outsourcing asylum responsibilities to such a regime carries obvious moral risks and practical dangers. Once such an arrangement begins, the host country could easily gain leverage over Britain. If the regime were to face political instability or eventual collapse — a common fate of authoritarian systems — the question of what would happen to those transferred there would become even more complicated. Ultimately the policy ran into major legal and political obstacles and never truly took effect.

The current Labour government has now introduced another measure: offering cash payments to some rejected asylum seekers to encourage voluntary departure. The logic is financial. Paying a lump sum may be cheaper than housing people for years. Yet in an already polarised political climate, such policies are easily framed as paying migrants with taxpayers’ money, which may only deepen public hostility.

Meanwhile, most European countries have moved in a different direction. Many allow asylum seekers to work after three to six months, enabling at least some of them to support themselves. Accommodation systems are also structured differently, with purpose-built reception centres rather than emergency hotel use. The European Union has gradually harmonised these policies, including reducing the maximum waiting time for labour market access to six months.

Looking back over this policy trajectory reveals a common pattern. Governments of different parties have repeatedly responded to anti-immigration pressure with stricter policies. Each step appeared politically safer in the short term. Yet over time these decisions pushed the system toward the most expensive and least efficient outcomes.

The work ban prevented self-sufficiency. Brexit weakened international cooperation. Slower processing created enormous backlogs. The Rwanda scheme consumed public funds without solving the problem. These policies may appear unrelated, but they follow the same political logic. When a system is designed primarily around deterrence, it can end up reinforcing the very problem it seeks to control. The result is a self-fulfilling policy trap.

Restoring order to the system may not require complicated innovations. Many European countries recognise a basic reality: asylum seekers waiting for decisions need the opportunity to work, and cross-border cooperation is essential for managing migration. If Britain wishes to escape its current predicament, the answer may not lie in ever tougher policies but in learning from the approaches already used across Europe. In the long run, rebuilding institutional cooperation with Europe may be the most straightforward path back to a functioning system.

From Work Ban to Hotel Requisition: Britain’s Self-Fulfilling Asylum Policy Trap Read More »

One Formula, Billions in Funding: How the UK Allocates Money to Scotland, Wales and Northern Ireland

The UK spends hundreds of billions of pounds on public services every year. Yet when it comes to Scotland, Wales and Northern Ireland, many people struggle to explain how the money is actually allocated. It is often assumed that there must be a sophisticated formula calculating what each nation should receive. In reality, the mechanism used to adjust these allocations is surprisingly simple. It is known as the Barnett formula.

The Barnett formula was introduced in 1978 and is named after Joel Barnett, who was then Chief Secretary to the Treasury. Its origin was pragmatic rather than constitutional. When spending on public services in England increased or decreased, the government needed a quick way to adjust the budgets of Scotland, Wales and Northern Ireland at the same time. The Barnett formula was designed to solve that problem. It deals with how much spending should rise or fall, not with how total resources should be distributed.

The calculation itself is straightforward. When the UK government increases spending on a service in England that is devolved elsewhere, such as health or education, the other three nations receive a proportionate increase based largely on population. If spending on a service in England rises by £10 billion, Scotland, Wales and Northern Ireland receive additional funding according to their population shares. Because the adjustment happens automatically, the Barnett formula is often described as an automatic mechanism for increasing or decreasing funding.

The crucial point is that the formula only applies to changes in spending, not to the overall level of funding. Each devolved administration already has a baseline budget, and that baseline was not determined by the formula. It emerged gradually from historical spending decisions and political negotiations. If one nation started with higher spending per person, the formula does not correct that difference. It simply increases or decreases funding on top of the existing base.

One of the most prominent recent controversies illustrates how this works in practice. The high speed rail project HS2 is being built entirely within England. Yet the UK government classified it as an England and Wales project. One argument originally put forward was that HS2 could allow trains from North Wales to reach London more quickly through connections to the new network.

Rail infrastructure in Wales is not fully devolved. Because of this classification, HS2 spending does not trigger additional Barnett funding for the Welsh government. Politicians in Wales have therefore argued that a railway built entirely in England is being treated as a project benefiting Wales, and that Wales is losing funding it would otherwise have received.

The argument became more contentious after later changes to the project. Parts of Phase 2 were cancelled, including the section that would have connected Birmingham to Manchester. As those plans were abandoned, the earlier claim that the project would significantly improve rail journeys for North Wales became harder to sustain.

The dispute highlights an important limitation of the Barnett formula. The formula only operates when spending is classified as applying to England alone. If the UK government categorises a programme as covering England and Wales together, additional funding for Wales may not be triggered even if the spending itself takes place almost entirely in England. In many cases, the political argument is therefore not about the calculation itself, but about how spending is classified.

The contrast with Germany makes the difference clearer. Germany is a federal state with a formal system of fiscal equalisation between its regions. The system calculates the fiscal capacity of each state. Wealthier states transfer resources to poorer ones, and the federal government also provides additional support. The objective is explicit. Public services across Germany should not diverge too widely simply because some regions are richer than others.

The UK system works very differently. The Barnett formula does not measure fiscal capacity and it does not aim to equalise spending levels. It simply distributes changes in spending on top of existing budgets. As a result, public spending per person in Scotland has long been higher than in England, with Wales and Northern Ireland also typically receiving more per capita. The formula itself does not attempt to remove those differences.

Another striking feature is that the Barnett formula was never intended to become a permanent system. It was introduced as a temporary administrative arrangement. Yet it has remained in place for decades. As devolution developed and the powers of Scotland, Wales and Northern Ireland expanded, this simple mechanism gradually became a central part of how funding is allocated within the United Kingdom.

On the surface the Barnett formula looks like a neat calculation. In practice it reflects a political compromise embedded in the UK’s constitutional structure. Compared with the carefully designed fiscal equalisation systems found in federal countries such as Germany, the UK approach is remarkably simple. Public spending is not determined by a comprehensive formula calculating fairness. Instead, it evolves gradually on top of historical spending patterns.

Understanding the Barnett formula therefore reveals something broader about the UK state. Many of its most important institutions were not created through grand design. They emerged incrementally and persisted because they were convenient. The allocation of public spending across the UK’s nations is no exception.

One Formula, Billions in Funding: How the UK Allocates Money to Scotland, Wales and Northern Ireland Read More »

Why Do UK Student Loans Never Seem to End? In Reality They Are a Graduate Tax with a Cap

Why do UK student loans often appear impossible to repay? The reason is not simply the size of the debt, but the way the system is designed. In practice the UK student loan functions less like a conventional loan and more like a graduate tax, except that the tax stops once the loan and interest have been fully repaid.

Students in England can usually borrow two types of loans while at university. The first is a tuition fee loan, which pays the university directly. The tuition fee cap for domestic students in England is currently £9,535 per year. The second is a maintenance loan, paid directly to the student to cover rent, food, transport or other living costs. Students can spend this money as they wish. Because the maintenance loan is substantial, the total amount borrowed over three years often exceeds £50,000.

The key feature of the system is income-contingent repayment. Graduates only begin repaying once their income exceeds a certain threshold. For those who started university between 2012 and 2022, this is known as Plan 2. The repayment threshold in 2025 is £27,295, and the government has announced that it will rise to £28,470 from April 2025. Graduates repay 9 percent of income above this threshold. If earnings fall below the threshold, no repayment is required.

The amount repaid therefore depends on income rather than the total debt. Suppose a graduate earns £38,470 a year. With a threshold of £28,470, the income above the threshold is £10,000, meaning annual repayments of £900, or about £75 per month. Whether the outstanding loan is £40,000 or £70,000 does not change the repayment that year.

Plan 2 loans also have a time limit. Any remaining balance is written off 30 years after repayments begin. Research by the Institute for Fiscal Studies (IFS) suggests that only about a quarter of borrowers will fully repay their loans under this system. Most borrowers will still have a balance outstanding when the write-off occurs.

The system therefore behaves very much like a graduate tax. Higher earners repay more and are more likely to clear the full balance. Lower earners may repay only part of the loan before the remaining amount is written off by the government. Once the loan and interest have been fully repaid, deductions stop immediately.

Interest rates are also income dependent. Under Plan 2 the rate is based on the Retail Price Index with an additional margin of up to three percentage points. Students are normally charged RPI plus three percent while studying. After graduation the rate varies with income. Only the highest earners pay the maximum RPI plus three percent, while those on lower incomes pay interest closer to RPI alone.

Another less discussed feature is the repayment threshold itself. The system was originally designed so that the threshold would rise with inflation. In practice, however, governments have sometimes frozen the threshold and at other times increased it substantially. As a result, borrowers from different cohorts may face very different effective repayment burdens even under the same scheme. If student loans are effectively a graduate tax, the threshold arguably should be tied to inflation in law rather than adjusted at political discretion.

The UK student loan system also contains several different plans. Plan 1 applies mainly to students who began university before 2012 in England or Wales. Interest rates are generally lower under this plan. Plan 3 covers postgraduate loans, including both master’s and doctoral programmes. Plan 4 applies to students from Scotland and operates similarly to Plan 1 but with a higher repayment threshold.

Students starting university in England from 2023 fall under a new system known as Plan 5. The repayment threshold is lower and the repayment period has been extended to 40 years. Interest is fixed at the rate of inflation, measured by the Retail Price Index, without the additional margin used under Plan 2.

Understanding UK student loans therefore requires looking beyond the headline debt figure. What matters is not the size of the loan but the repayment rules. In practice the system functions like a graduate tax with an upper limit. The real policy question is not whether the debt can be repaid in full, but whether this structure remains a stable and transparent way to share the cost of higher education.

Why Do UK Student Loans Never Seem to End? In Reality They Are a Graduate Tax with a Cap Read More »

Britain’s Minimum Wage Is Three Times Hong Kong’s. That Is No Accident

Britain’s minimum wage is far higher than Hong Kong’s, but the more important point is that this difference is intentional. From 1 April 2026, the UK National Living Wage for workers aged 21 and over will rise to £12.71 per hour. At recent exchange rates, that is about HK$132. Hong Kong’s statutory minimum wage is currently HK$42.1 per hour and will increase to HK$43.1 in May 2026, subject to legislative approval. Even using the new figure, Britain’s legal minimum remains about three times higher than Hong Kong’s. The gap reflects not only living costs but also very different policy choices.

Hong Kong’s minimum wage functions mainly as a safety floor to prevent extreme exploitation. Adjustments are usually cautious and framed around avoiding damage to employment. Britain treats minimum wage policy quite differently. It is seen as a tool to reshape the low-pay labour market. The system is guided by the Low Pay Commission, an independent advisory body that brings together representatives of employers, trade unions and the government. Each year it reviews economic conditions and labour market data before recommending the new statutory rates, which governments have generally followed.

A key feature of the British approach is that the minimum wage is linked to the distribution of wages across the economy. In 2020 the government set a target to raise the National Living Wage to 60 percent of median earnings. Since then the policy has been to keep it close to about two thirds of the median, roughly 65 to 66 percent. This means the minimum wage is not adjusted only by inflation. Instead it is designed to track the broader wage structure. As overall pay rises, the wage floor rises as well. The intention is clear. The policy aims to lift the lower end of the labour market rather than simply protect the very bottom.

This design has produced measurable effects. When the minimum wage rises, the pay of the lowest-paid workers increases directly. The gap between the bottom and the middle of the wage distribution narrows, reducing overall inequality. Over the past decade the earnings of low-paid workers in Britain have generally grown faster than average wages. Another purpose of the policy is to reduce “in-work poverty”. When wages are extremely low, governments often have to supplement incomes through welfare benefits. Raising the minimum wage shifts some of that burden back to employers and the market.

However, a high wage floor also creates tensions. As the minimum wage moves closer to the middle of the wage distribution, the gap between entry-level and more senior roles narrows. For firms this compresses internal pay structures. For workers it may weaken incentives for promotion. If the wage difference between frontline staff and supervisory roles becomes small, some employees may feel less motivation to take on additional responsibility for a modest pay rise. This compression of the pay ladder has already appeared in parts of the retail and service sectors.

Another long-standing debate is whether higher minimum wages cost jobs. The Institute for Fiscal Studies (IFS) notes that past increases in Britain have not led to clear evidence of large employment losses overall. Many businesses have absorbed the cost through productivity improvements, small price increases or reduced margins. Yet researchers also stress that this does not mean the wage floor can rise indefinitely without consequences. As the minimum wage approaches the middle of the pay distribution, firms have less room to adjust and employment risks may grow. The key question is not whether there is a limit, but where that limit lies.

Young workers are often the most sensitive group. Britain has long maintained different minimum wage rates for different age groups. The rationale is that younger workers typically have lower experience and productivity, so a single high wage floor could discourage firms from offering entry-level jobs. The Labour government has proposed gradually extending the National Living Wage to younger age groups, but it has recently shown greater caution. The concern is that raising youth wage floors too quickly could make employers less willing to hire young people during uncertain economic conditions.

Research has not reached a single conclusion that minimum wages have already harmed youth employment in a clear way. Some studies, however, suggest firms may adjust in subtler ways. Instead of cutting jobs outright, employers might reduce working hours, raise hiring standards or cut back on training and apprenticeship places. These changes may not immediately appear in unemployment figures, but they can affect how easily young people enter the labour market. The Low Pay Commission has therefore warned that youth wage policy should be approached carefully to avoid damaging entry-level opportunities.

Minimum wages look like a single number, but they reflect a broader social choice. Britain has chosen to push the wage floor higher in order to reduce inequality and lift low pay, while expecting businesses to adapt through higher productivity. Hong Kong has taken a more cautious approach, maintaining a basic safety line to avoid sharp disruptions to employment. As the wage floor moves closer to the centre of the wage distribution, the debate becomes less about the level itself and more about the adjustment it forces on the labour market. A higher floor raises incomes, but it also reshapes incentives and costs. The real question is how much adjustment a society is willing to accept.

Britain’s Minimum Wage Is Three Times Hong Kong’s. That Is No Accident Read More »

British Columbia Ends Winter Time: Will Other Canadian Provinces and U.S. States Follow? What Is Europe Waiting For?

On 8 March 2026, British Columbia will move its clocks forward for the final time, becoming the first Canadian province to abolish winter time. The decision does not bind the rest of Canada, but it breaks a long pattern of hesitation.

Under current rules, North America begins daylight saving time on 8 March 2026 and returns to standard time on 1 November. Europe will switch on 29 March and revert on 25 October. Australia and New Zealand will end daylight saving time on 5 April 2026 and resume it on 27 September. In other words, most jurisdictions that observe seasonal clock changes will continue as usual in 2026. British Columbia stands apart.

In Europe, the European Parliament voted in 2019 to end the twice-yearly clock changes and allow member states to choose either permanent standard time or permanent daylight saving time. The reform was originally scheduled for 2021. It stalled because governments could not agree on which option to adopt, and because the pandemic and subsequent energy crisis displaced the issue. The Parliament’s position remains on record, but the Council has yet to forge consensus. The obstacle is no longer principle, but coordination.

British Columbia’s case rests on familiar arguments. Research links clock changes to sleep disruption, short-term rises in traffic accidents and cardiovascular stress. Businesses must adjust systems and schedules twice a year. A fixed time is presented as a modest but tangible gain in stability. Yet time policy is not only about health. It is also about integration.

British Columbia shares the Pacific time zone with Washington State. Vancouver and Seattle are closely connected economically. In several border towns, neighbourhoods function as a single community across the line. Schools, shops and services intertwine. If a sudden one-hour gap emerges each winter, daily routines could be thrown off. Commuters, shift workers and families who cross the border regularly would have to recalibrate their lives. The difference is small in theory, but it may be disruptive in practice.

For years, provinces and states have waited on one another. Ontario has passed legislation supporting permanent daylight saving time, conditional on neighbouring U.S. states doing the same. More than 19 U.S. states have approved similar measures, pending action by Congress. Each side has been waiting for the other. With British Columbia now moving first, the question is whether it becomes a catalyst for broader reform in North America, or remains an isolated case.

Daylight saving time was once justified as an energy measure. The world it was designed for has changed. Digital markets operate across time zones. Supply chains span borders. British Columbia has chosen to act rather than wait. Whether others follow will reveal how willing governments are to bear the cost of leading, instead of postponing yet again.

British Columbia Ends Winter Time: Will Other Canadian Provinces and U.S. States Follow? What Is Europe Waiting For? Read More »

Every Time Oil Prices Surge, They Remind Us of One Thing: We Are Not Moving Fast Enough

As conflict spreads across the Middle East, Brent crude has risen from around $60 a barrel to about $76, an increase of more than 25%. Some analysts warn that if tensions escalate further, prices could approach $100. Natural gas prices have also jumped sharply, with European futures rising by more than 30% in a short period. Oil and gas are moving together. Markets are repricing geopolitical risk. When the risk premium rises, transport costs rise, generation costs rise, and electricity bills follow.

The impact of gas prices on electricity markets is particularly direct. In Britain and much of Europe, wholesale power prices are set by the marginal plant — often a gas-fired station. When gas prices spike, electricity prices are pushed up, even if the cost of wind and solar remains unchanged. This mechanism was brutally clear during the 2022 energy crisis. Today’s oil and gas surge is a reminder that the structure has not fundamentally changed.

In this context, some critics argue that net zero policies and renewable expansion are to blame for high electricity prices. They claim that the energy transition is the culprit. This diagnosis is wrong. The immediate cause of rising prices is geopolitical instability and supply risk, not the development of wind and solar. The real question is not whether the transition exists, but whether conditions would be worse without it.

This is where counterfactual analysis becomes essential. A counterfactual is not a simple comparison between now and the past, nor is it a crude comparison between one country and another. It asks us to compare two possible worlds. In one world, over the past decade, we invested heavily in wind and solar and reduced dependence on fossil fuels. In the other, we did not. The relevant question is not why prices are rising despite renewables, but whether prices would be even higher without them.

Research from University College London has shown that the expansion of wind power in the UK has reduced wholesale electricity prices and saved consumers billions of pounds over recent years. During periods of high gas prices, wind generation has acted as a buffer. Without that additional wind capacity, electricity bills and government support costs would have been significantly higher. That is what a proper counterfactual comparison reveals.

Climate sceptics focus on the fact that prices are high even with renewables. But they fail to ask whether the shock would have been larger without them. Global fossil fuel supply remains concentrated in regions dominated by authoritarian regimes. Price risk and political risk are intertwined. Dependence on those supplies is itself a structural vulnerability.

Energy policy is ultimately about risk management. Wind and sunlight are domestic resources. They are not subject to embargoes, sanctions, or conflict. Building renewable capacity requires capital investment, but once installed, marginal costs are close to zero. Fossil fuels, by contrast, require continuous purchases at prices determined by global markets and geopolitical tensions. This is not an ideological debate. It is about exposure to volatility.

If oil prices do approach $100 again, the lesson will not be that the transition has gone too far. It will be that we have not gone far enough. The problem is not transition. It is overdependence on fossil fuels. Every surge in oil and gas prices is a reminder that energy security and price stability depend on accelerating the shift toward locally produced renewable energy, rather than remaining primarily reliant on fossil fuels produced in politically unstable parts of the world.

Every Time Oil Prices Surge, They Remind Us of One Thing: We Are Not Moving Fast Enough Read More »

Why So Many Hongkongers Are Settling in Milton Keynes: From Mong Kok to MK

To Hongkongers, MK means Mong Kok. Neon lights, packed pavements, relentless density. In Britain, MK stands for Milton Keynes. The initials are the same. The reality could not be more different. What attracts many Hongkongers is precisely that contrast.

Milton Keynes was designated in 1967 and is widely regarded as the last major new town built in the United Kingdom. With a population of around 290,000, it was planned from scratch with modern life in mind. Wide roads, low housing density and abundant green space define its character. For families arriving from one of the most crowded cities in the world, this sense of space is not cosmetic. It is transformative.

Location is central to its appeal. Trains to London take roughly 30 to 40 minutes, making commuting realistic. At the same time, the town sits between London, Cambridge and Oxford, forming part of what is often described as the knowledge triangle of southern England. For professionals in finance, technology and academia, this geography matters. It offers access without the full cost of living inside the capital.

There is also a social dimension. Early arrivals under the BNO route looked for places outside London where property was more affordable and houses larger. Milton Keynes met that requirement. Once a critical mass of Hongkongers settled, churches, tutoring centres and Cantonese restaurants followed. Migration rarely spreads evenly. It clusters. Familiar networks reduce uncertainty, and word of mouth accelerates the flow.

The town’s design further distinguishes it. Milton Keynes is built on a grid road system, with major junctions largely structured as roundabouts. There are well over a hundred of them. Traffic generally flows smoothly. The town was planned for cars, not constrained by medieval street patterns. For many families, having a driveway and a garden is more valuable than living above an Underground station. At the same time, the redway network of cycle and pedestrian paths allows safer movement away from main roads.

Amenities are substantial. The large central shopping complex, indoor leisure facilities, theatres, lakes and parks create a balanced environment. Willen Lake and other green spaces provide room for outdoor life. Schools in the area are generally well regarded, an important consideration for families relocating with children. Compared with London, similar budgets often secure significantly larger homes.

Milton Keynes also contains a site of historical weight. Bletchley Park, located within the borough, served as Britain’s codebreaking centre during the Second World War. Alan Turing and his colleagues worked there to decrypt German communications, influencing the course of the war. Today it stands as a museum, adding depth to what is otherwise a relatively young town.

Looking ahead, the future may reinforce its position. The proposed Oxford–Cambridge Innovation Arc seeks to strengthen economic and research links between Oxford, Cambridge and the towns in between. Milton Keynes sits within this corridor. The East West Rail project, progressing in stages, aims to connect Oxford, Milton Keynes and Cambridge directly. If fully delivered, it would improve east–west connectivity and potentially enhance the area’s economic attractiveness. For homeowners, this is not merely about lifestyle. It is about long term positioning.

Migration decisions are rarely romantic. They are calculations. From Mong Kok to Milton Keynes, the initials may match, but the scale and pace of life do not. For many Hongkongers, that difference is exactly the point.

Why So Many Hongkongers Are Settling in Milton Keynes: From Mong Kok to MK Read More »

Scroll to Top